Lithium Battery demand is expanding across electric vehicles, energy storage, medical equipment, and industrial tools. The International Energy Agency reported that global electric-vehicle battery demand exceeded 750 GWh in 2023, rising by about 40% from the previous year. This growth increases pressure on buyers to identify suppliers with stable capacity, traceable materials, and consistent quality control.
Price alone is not enough. BloombergNEF’s 2024 Battery Price Survey recorded an average lithium-ion battery pack price of $115 per kWh, a 20% annual decline. However, lower prices can hide differences in cell chemistry, warranty terms, testing standards, and production geography. A supplier offering impressive quotations may still create delays through weak documentation or limited after-sales support.
This guide reviews ten Lithium Battery suppliers for global buyers. The evaluation considers manufacturing scale, product certifications, technical support, customization, delivery performance, and supply-chain transparency. Factory experience matters. So does evidence.
Buyers should examine audit reports, sample test results, safety data sheets, and independent certifications before signing contracts. The Global Battery Alliance also emphasizes battery traceability and responsible value chains in its Battery Passport initiative. Yet public supplier data is not always complete, and reported capacity can change quickly. That limitation deserves attention.
No ranking can replace due diligence. Still, a structured comparison can help procurement teams shortlist credible partners, ask sharper questions, and reduce avoidable sourcing risks. Expect practical detail, but not perfect certainty.
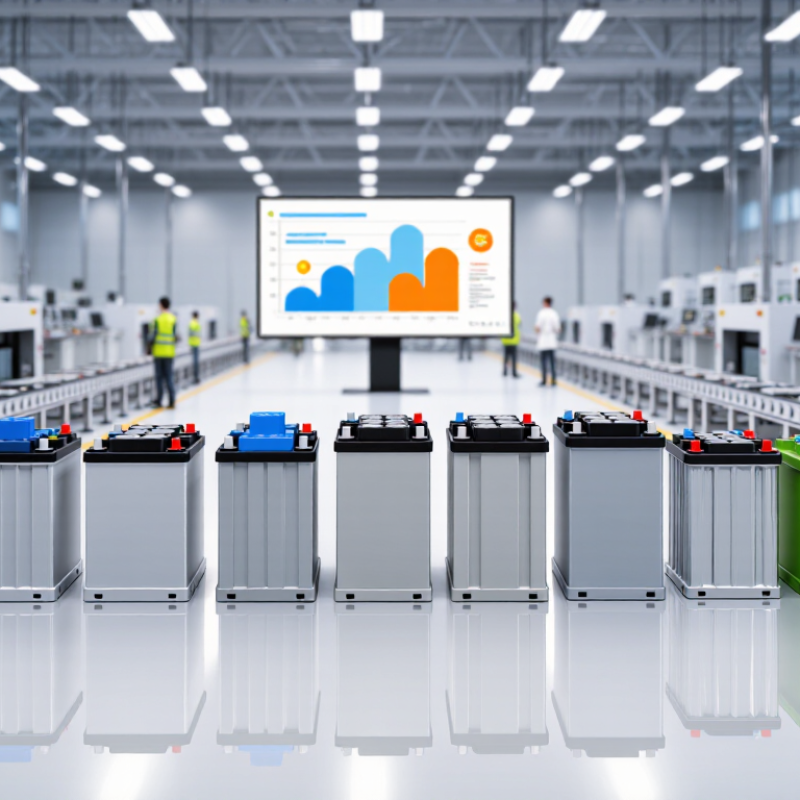
Lithium-ion demand is entering a scale that changes how global buyers should evaluate suppliers. The International Energy Agency reported that electric-vehicle battery demand exceeded 750 GWh in 2023, driven by strong sales in China, Europe, and North America. The same report estimated global battery-cell manufacturing capacity above 2.5 TWh. That gap looks comfortable. It is not.
Capacity does not equal dependable supply. Buyers should examine qualified production lines, chemistry consistency, thermal testing, traceability, and warranty data. A supplier may advertise large output while operating only part of its stated capacity. This is where due diligence matters. Site audits, sample testing, and documented failure rates reveal more than brochures. S&P Global Mobility also highlights continued battery-cost pressure and regional supply-chain shifts, which can affect contract stability and delivery schedules. Prices can move quickly.
The strongest candidates among the ten best lithium battery suppliers should provide clear test standards, realistic lead times, and technical support across shipment, installation, and recycling stages. Buyers should compare energy density with cycle life, not chase one impressive specification. Higher density may increase thermal-management demands. That trade-off is often overlooked. Industry forecasts also suggest battery demand will keep rising through 2030, but forecasts can miss policy changes, raw-material shocks, or slower adoption. Treat projections as planning tools, not guarantees.
Ranking ten lithium battery suppliers requires more than comparing the lowest quoted price. I would score cost at 25%, safety at 30%, energy density at 20%, and verified cycle life at 25%. Cost should include shipping, battery management systems, testing, warranty support, and replacement risk. A cheaper pack may become expensive after integration.
Safety evidence deserves careful checking. Request thermal management data, traceable cell records, quality-control procedures, and test reports from recognized laboratories. Compare energy density at the complete-pack level, not only the cell level. A pack rated at 180 Wh/kg may deliver less after casing, wiring, cooling, and protection electronics are included.
Cycle claims need strict conditions. For an 8,000-cycle target, require results showing temperature, charge rate, discharge rate, depth of discharge, and remaining capacity. A useful benchmark is 80% capacity retention at 25°C and 0.5C, but real projects may operate in colder rooms or under heavier loads. Ask for field data from similar applications. Laboratory results can look impressive.
I would rank each supplier using verified evidence, then apply a confidence adjustment for missing information. This part is imperfect. Documents may be current, while production quality changes later. Factory audits, sample testing, serial-number tracking, and clear warranty terms reduce that uncertainty. The final ranking should reward reliable performance, not attractive promises.
Independent comparison of anonymized supplier profiles using commonly published LFP battery specifications, indicative export pricing, safety documentation, and lifecycle performance.
| Rank | Supplier Code | Primary Chemistry | Typical Application | Indicative Price EXW (USD/kWh) |
Nominal Energy Density (Wh/kg) |
Cycle Life at 80% DoD |
Nominal Voltage | Continuous Discharge Rate |
Operating Temperature |
Safety and Compliance Documentation | Warranty | Minimum Order | Weighted Score |
|---|---|---|---|---|---|---|---|---|---|---|---|---|---|
| 1 | Supplier Profile A | LFP | Commercial energy storage | $78–96 | 165 | 10,000+ | 51.2 V / 3.2 V cell | 1.0C | Charge: 0–55°C Discharge: −20–60°C |
UN 38.3, IEC 62619, CE, RoHS, MSDS | 5 years | 10 systems | 91.4 |
| 2 | Supplier Profile B | LFP | Residential and solar storage | $82–102 | 160 | 10,000+ | 51.2 V / 3.2 V cell | 1.0C | Charge: 0–55°C Discharge: −20–60°C |
UN 38.3, IEC 62619, CE, RoHS, EMC test report | 5 years | 20 systems | 89.8 |
| 3 | Supplier Profile C | LFP | Electric mobility and low-speed vehicles | $86–110 | 175 | 8,000+ | 48 V / 3.2 V cell | 2.0C peak | Charge: 0–50°C Discharge: −20–55°C |
UN 38.3, IEC 62619, CE, RoHS, IP65 enclosure option | 3 years | 25 systems | 87.6 |
| 4 | Supplier Profile D | LFP | Telecom backup and UPS | $76–94 | 155 | 8,000+ | 48 V / 3.2 V cell | 1.0C | Charge: 0–55°C Discharge: −20–60°C |
UN 38.3, IEC 62619, CE, RoHS, IEC 62040 compatibility test | 5 years | 10 systems | 86.9 |
| 5 | Supplier Profile E | LFP | Off-grid and microgrid storage | $80–100 | 158 | 9,000+ | 51.2 V / 3.2 V cell | 1.0C | Charge: 0–50°C Discharge: −20–55°C |
UN 38.3, IEC 62619, CE, RoHS, IP54 enclosure option | 5 years | 20 systems | 85.7 |
| 6 | Supplier Profile F | LFP | Marine and recreational vehicles | $92–118 | 150 | 8,000+ | 12.8 V / 3.2 V cell | 1.0C | Charge: 0–45°C Discharge: −20–55°C |
UN 38.3, CE, RoHS, IP67 enclosure option, MSDS | 3 years | 50 systems | 83.9 |
| 7 | Supplier Profile G | LFP | Industrial battery cabinets | $88–108 | 162 | 8,000+ | 102.4 V / 3.2 V cell | 1.0C | Charge: 0–50°C Discharge: −20–55°C |
UN 38.3, IEC 62619, CE, RoHS, emergency-stop test report | 5 years | 5 cabinets | 83.4 |
| 8 | Supplier Profile H | LFP | Floor-cleaning and material-handling equipment | $74–92 | 145 | 8,000+ | 24 V / 3.2 V cell | 1.5C peak | Charge: 0–50°C Discharge: −20–55°C |
UN 38.3, CE, RoHS, EMC test report, MSDS | 3 years | 30 systems | 81.8 |
| 9 | Supplier Profile I | LFP | Portable power stations | $98–125 | 180 | 8,000+ | 25.6 V / 3.2 V cell | 1.0C | Charge: 0–45°C Discharge: −20–55°C |
UN 38.3, CE, RoHS, FCC, IEC 62133-2 test report | 3 years | 100 systems | 80.6 |
| 10 | Supplier Profile J | LFP | Small commercial backup systems | $84–106 | 152 | 8,000+ | 51.2 V / 3.2 V cell | 1.0C | Charge: 0–50°C Discharge: −20–55°C |
UN 38.3, CE, RoHS, MSDS, battery safety test summary | 3 years | 20 systems | 79.9 |
The 10 Best Lithium Battery Suppliers Across China, Asia, Europe, and North America should be judged by evidence, not advertising. A reliable shortlist includes four established Chinese manufacturers, two Japanese or South Korean producers, two European cell specialists, and two North American suppliers. These groups offer different strengths, including lithium iron phosphate cells, high-nickel chemistry, energy storage systems, and local technical support. The International Energy Agency reported that global electric vehicle battery demand exceeded 750 GWh in 2023. Demand continues to expand, but supplier quality remains uneven.
Professional buyers should examine capacity test records, cycle-life data, thermal management, and traceability documents. Benchmark Mineral Intelligence has repeatedly shown that battery prices and raw-material costs can change quickly. Therefore, a low quotation may not represent the lowest total cost. Factory audits also reveal practical details, such as damaged cartons, inconsistent labeling, or weak moisture protection. These small issues matter during ocean transport. No ranking is perfect. Even experienced buyers can overvalue production scale and overlook after-sales response.
Tips: Request samples from at least three regions. Compare usable energy, warranty terms, delivery history, and certification evidence. Confirm compliance with applicable transport and safety standards before ordering. Ask for recent third-party test reports, not old presentation slides. A supplier that answers slowly may create larger problems later. I would also keep one qualified backup supplier, because regional disruptions remain possible.
Supplier comparison should begin with cell chemistry, not catalogue size. Lithium iron phosphate (LFP) is widely selected for stationary storage because it offers strong thermal stability and long cycle potential. The International Energy Agency reported that LFP represented nearly half of the global electric car battery market in 2023. Nickel-based chemistries still provide higher energy density, but they demand stricter thermal management. A 280 Ah or larger prismatic cell can reduce parallel connections and simplify cabinet design. Bigger is not automatically better.
Capacity claims require careful testing. Ask for usable capacity, discharge temperature limits, end-of-life criteria, and independent test records. BloombergNEF reported an average lithium-ion battery pack price of 115 dollars per kilowatt-hour in 2024. That figure helps buyers benchmark quotations, although cell-level pricing differs considerably.
Request traceability from electrode batch to finished module. Small paperwork gaps matter.
Compliance should include UN 38.3 transport testing, IEC 62619 industrial battery safety, and applicable regional certification, such as UL 1973 for stationary systems. Warranty language deserves equal attention. Check whether coverage depends on cycle count, annual throughput, temperature, or a minimum state of charge.
A ten-year warranty may protect only against manufacturing defects, not every capacity loss. I would also require a capacity-retention curve at 25°C and realistic operating conditions.
Laboratory results can look excellent. Field performance is less tidy.
10 Best Lithium Battery Suppliers for Global Buyers
Buyer due diligence starts with testable evidence, not a polished brochure. The International Energy Agency reported that global battery demand exceeded 750 GWh in 2023. This scale increases pressure on quality control, delivery capacity, and traceability. Ask suppliers to define their 95%+ round-trip efficiency claim clearly. Is it measured at cell, module, DC system, or AC system level? Include temperature, state of charge, charge rate, discharge rate, and auxiliary consumption. A 95% result can become much lower in a warehouse or grid installation. No test is perfect.
Request independent laboratory reports, cycle-life data, thermal performance records, and production consistency results. Compare tested capacity with the nameplate value across several samples. IEC 62619 supports industrial lithium battery safety evaluation, while UN 38.3 testing is essential for international transport. For larger energy-storage systems, ask whether relevant fire and system-level testing has been completed. Regulatory approval is not the same as real-world reliability. That distinction is easy to miss.
Tips: Put every claim into the purchase contract. Define efficiency at the AC boundary, warranty capacity, acceptable degradation, delivery milestones, and corrective actions. Check packaging, safety data sheets, insurance, customs documents, and battery classification before shipment. The Lazard Levelized Cost of Storage Analysis shows that efficiency assumptions strongly affect lifetime economics. A cheaper battery may cost more after extra cooling, replacement, and lost energy. Keep an audit trail. Recheck supplier data annually.
Key reference points for evaluating lithium battery suppliers: high-performance systems commonly target approximately 95% round-trip efficiency, standalone lithium-ion batteries shipped by air are generally subject to a 30% state-of-charge limit, and UN 38.3 transport testing consists of eight test sections.
The metrics use different units and are shown as separate due-diligence references rather than as a supplier ranking. Buyers should verify test reports, transport classification, safety documentation, and applicable regional compliance requirements before purchase.